✨ Version 1.0.1
FeaturedStop guessing.
Start Measuring.
Get instant FCP, LCP, and DOM timings for any tab. Find the bottlenecks slowing down your application with zero setup.
Local Data Only
< 50 kB
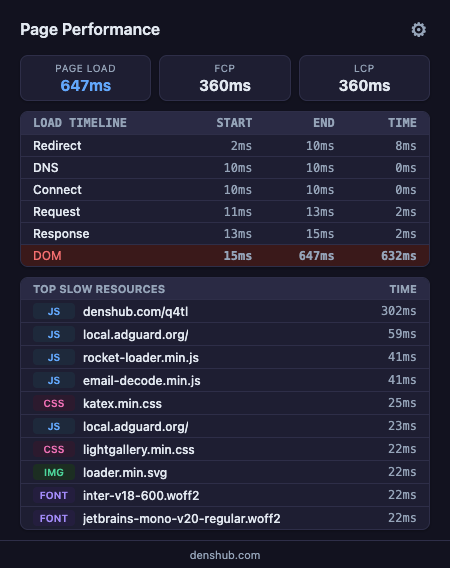
Light & Dark Modes
Get instant FCP, LCP, and DOM timings for any tab. Find the bottlenecks slowing down your application with zero setup.
| Phase | Start | Duration |
|---|---|---|
| Request / DNS | 0ms | 308ms |
| Server Response | 319ms | 58ms |
| DOM Processing | 377ms | 701ms |
| XHR | batchexecute (API) | 368ms |
| JS | main-bundle.js | 197ms |
| CSS | fonts.css | 88ms |
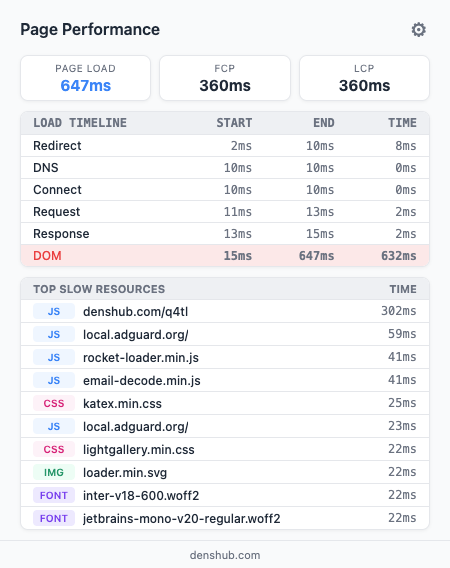
Explore how the extension visualizes page load performance. View core metrics like FCP and LCP, a clear breakdown of load stages, and the slowest resources. Supports light and dark themes and adapts to your browser automatically. Click any screenshot to enlarge.
Ever wonder if a website is slow or just poorly optimized? Get an instant answer. See exactly how long a page takes to load and which part is slowing it down. Explore a clear breakdown of the loading process. No technical knowledge or complex tools required.
Analyze Core Web Vitals in real time while the page loads. Break down the loading process step by step and pinpoint the exact API call, script, or resource impacting your render path. No need to open Chrome DevTools or rely on heavy, specialized tools.
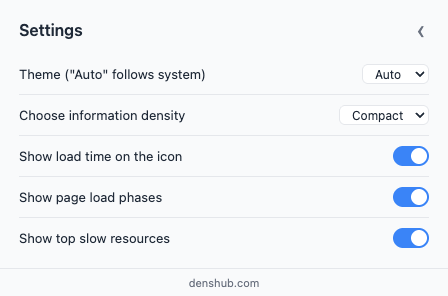
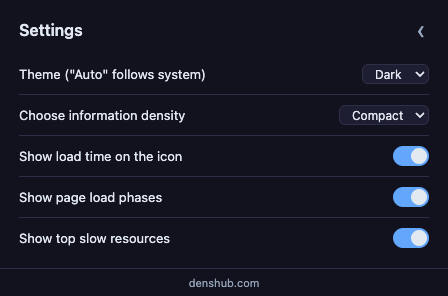
Tailor the settings to your needs:
Your data stays on your device.
This extension does NOT collect any data. It uses the browser's local Performance API to calculate metrics right on your device. No analytics. No tracking servers.
Join thousands of developers optimizing their browsing experience.
Install from Chrome Web Store